Wednesday, September 24, 2008

Bull Spread - Long OTM Call Condor

Image

Bullish Spread - Long OTM Call Condor

Like the Long OTM Butterfly, the Long OTM Call Condor involves 4 option positions, which means, it can be costly in terms of commissions.

The easiest way to understand this bullish spread is to view it as :

Long OTM Call Spread and Short even further OTM Call Spread

The Short position helps to fund the cost of the Long OTM Call Spread.

When to use : Mild Bullish Trend
How to establish : LONG OTM Call Spread and SHORT a higher strike Call Spread
Debit or Credit : Debit
Margin Requirement : No
What is the Maximum Profit : The distance between the LONG and SHORT Strikes (limited) - debit paid
What is the Maximum Loss : Amount paid (the debit) for the spread (limited)

Example :

Amgen (AMGN) is at $58. Long 60/62.5 Call vertical is trading at 66cents. The Short 65/67.5 Call vertical is trading at 14 cents. This Long OTM Call Condor is established with a 52 cents (66 - 14) debit.


Profit/Loss Explanation :

Debit (means you pay) for Long 60/62.5 Call Spread = 0.66
Credit (means you receive) for Short 65/67.5 Call Spread = 0.14
Total Debit = 0.52

Maximum loss = 0.52
Maximum Profit = 1.98 ( 62.5 - 60 - 0.52)
Breakeven points = 60.52 and 66.98
Profit Range = anything between the breakeven points
Probability of Success = ~25%

Risk/Reward Ratio = 0.52 / 1.98 = 0.26; ie you risk 0.26 for a profit potential of 1.00

Now, note that is a limited risk position and a limited reward one as well. The risk commensurates with the chance of success almost 1 to 1 relationship; ie 25% of success and a risk of 26cents to win $1. Very fair indeed.

Remember this is a Bullish Position, minus the risk of unlimited losses on a simple LONG AMGN stock position. The trade off is that it comes with a limited profit potential. That's trading and some say, life.

P/L Chart of AMGN Long 60/62.5/65/67.5 Call Condor


I have decidedly show the GREEKS to explain this condor.

Delta
It has a +ve 7.86 delta, which is good becos we always want a +ve delta for a bullish position, which this condor is.

Gamma
What is not good is the -ve 0.32 gamma. This is not good becos the -ve gamma will shrink the +ve delta position as AMGN price rallies. However, do note that this -ve gamma will turn positive at some time in the life of this condor position, provided AMGN rallies as desired. On the flip side, this -ve gamma will help this position from losing too much value should AMGN price drop. This is bcos the -ve gamma again will shrink the delta and with every dollar drop in AMGN, this overall condor option position will also drop lesser becos of the shrunk delta.

Theta
It has a +ve 0.09 theta, small though, but always very good becos as time passes, this condor position will gain from time decay rather than lose value, which happens for option positions that have -ve theta

Vega
It has a -ve0.21 vega, which is not necessary good. This is becos AMGN is currently at $58 and you will want the price to be somewhere between $60.52 and $66.98, which means you want AMGN price to MOVE. You want a +ve vega to help move the price of this condor position with increased volatility rather than a stationary AMGN volatility. Nevertheless, vega will change its polarity depending on what AMGN price is at.
Friday, September 12, 2008

About Rho

Rho

Rho, is the least mentioned among the greeks; delta, gamma, theta and vega.

Rho measures the impact the change in 1% risk free interest rate has on the value of the option.

In a gist, when Rho increases, the values of all Call options will increase and the values of all Put options will decrease.This occurs to every strike and expiration month options For example,

CSX : $61.61
35day 60Call : 5.10
35day 60Put : 3.40

The current risk free IR is 2%. Suppose, we increase that risk free IR by 1% to 3%, the revised Call and Put values will change. This change is caused by Rho.

35day 60Call : 5.13 (increased from 5.10)
35day 60Put : 3.37 (decreased from 3.37)

Explanation:

The reason that Calls become more expensive when IR increases, is because of "cost of carry". Remember that Call buyers have the right to exercise their Call options at any time before expiration. Supposing a trader had Long +10 6-month 55Call and is now ITM.
He could exercise this 55Call option and take delivery of CSX at $55/share but he will have to fork out $55,000 for this transaction immediately. He will still have the right to exercise his ITM Call option the next day, next week, next month or even right at the end of that 60day period. Why exercise it now, fork out $55,000 when he can deploy his $55,000 into a risk free instrument and obtain an assured interests for the next 6 months?
Of cos, if he feels that CSX will not rally any further from that juncture, he would be better just to close off this 55Call, take his profit and move on.
Hence, when risk free IR goes up, the less motivated a ITM Call option holder will be to exercise his call option. Since more people will be unwilling to do so when IR goes up, this premium is then reflected in the call option value. This is called the Cost of Carry.

Conversely, if a trader had a 60day ITM Put option, eg 60day 90Put, he will have the right to sell CSX at that strike price. Better for the trader to sell CSX at $90/share, quickly take his cash and put into a risk free instrument and earn the increased interests when holding onto those Put options earns no interest whatsoever. Hence, when Rho increases, more Put option holders will exercise their Put. Put values will drop as a consequence of increased Rho.

It would have to take a huge and sudden movement in risk free IR to have any significant impact on option values. And when such IR changes drastically, we have bigger issues to worry about.
Afterall, should the Fed Reserve Bank, decide tomorrow to raise IR from 2% to 5%, i doubt you will be rushing out to buy Call options, even when theoretically, the call values will rise.

Rho is primarily used by market makers when they hedge their positions against clients' and to price option premiums. Since they normally have very large, complex and constantly changing positions, they will take advantage of Rho to the maximum. Not so applicable for retail traders.

It is for completeness of Greek discussion, that I briefly elaborate on Rho.

About Vega

About Vega

The fifth brightest of all stars, and the third brightest in the northern sky. It will be the north polar star in about 12,000 years. In moving through the Milky Way Galaxy, the Sun is generally heading toward the position now occupied by Vega. At a distance of 7.8 parsecs (25.3 light-years, or 2.4 × 10¹⁴ km, or 1.49 × 10¹⁴ mi), Vega, or α Lyrae, is the prototypical star of spectral class A0V, indicating that it has an effective surface temperature of 9600 K (16,800°F) and derives its energy from the thermonuclear burning of hydrogen in a stable core region.

And so, Vega is really a name of a star.

But surprisingly, Vega affects option values, even when it is 25.3 light-years away. So, we best give it some attention.

Vega is an option model parameter that affects the value of an option, by the indicated amount, when Implied Volatility (IV) changes by 1%.

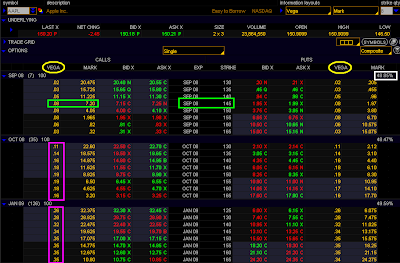
We will illustrate the concepts surrounding Vega by using Apple(AAPL) options. AAPL currently trades at $150.20


Sept145Call has a value of 7.20, and a vega of 0.08. The IV of this option is ~ 49%. If IV increases by 1% to 50%, this Sept145Call value will become approximately 7.28 (7.20 + 0.08). If the same call option's IV increases by 10%, thus making it 59%, then the Sept145Call will have a value of 8.00, because the vega will have increased by 10 times, from 0.08 to 0.8, as a result of 10% increase in IV.
Therefore, increasing the IV, increases the vega, which in turn increases the values of all options.
Conversely, should AAPL's volatility drop, say by 1% from 49% to 48%, that very same Sept145Call, whose original value was 7.20, now becomes 7.12 (7.20 - 0.08)
Now, you get the macro picture that IV affects option pricing via Vega (and other greeks, like Theta).

Why is Vega important?

It is important because if you were Long an option, whether a Long Call or a Long Put, you want your value of these options to go up. One way, in which these option values can increase, is by having large +ve Vegas. So that in the event, the IV increases, that large +ve Vega will also increase significantly enough to cause your option values to go up.
But, if you had WRITE Calls of Puts, you will want the value of those options you short, to decrease in value (sell high, buy low concept). One way for these options to decrease their values, is to possess -ve Vegas. In fact, when you have a NET Short position, that will automatically generate -ve Vegas.
-ve Vegas can hurt your overall portfolio, if IV spikes.

Note also that vega is smaller in the front months as compared to the further out months. This means that when IV changes, the further out months option values are more impacted because they possess larger Vegas as compared to the nearer months options.

Most traders do not to focus on Vega becos it is arguably more important to know how the IV is behaving. Afterall, what changes the vega is IV. Vega is just a resultant figure.

When IV increases all option values increase (it is so critical that it warrants repetition), for all Calls and Puts. And conversely, when IV drops, all option values drop, both Calls and Puts.

Look at the Theoretical Price (highlighted within green box)of both Calls and Puts when IV is adjusted up by 10%.


They are all higher than the "mark" value, which is the current traded value. You can easily imagine that when the IV drops by 10%, the values of all options, in each strike of each month, and every month, will decrease in value.

There is absolutely no need for AAPL share price to move 1 cent, for IV to cause option value to change drastically. This is the power of IV. So, Asian traders, the next time you buy a Call or Put warrant, remember, don't get suckered by the issuer adjusting the IV upwards. Once you buy, they turn down the IV, and without price changes to your underlying, the warrants can still lose a heck lot of value. Now, you know why warrants offered for trading in asian bourses, are ONE-sided trades, and you ain't the banker.

This is yet another reason, why you should be looking to Long options only when IV is comparatively low and Short options when IV is exceptionally high. Historical Volatility is used as a comparison. However, this is not always to be taken at face value. Some stocks' have increased volatility for extended months to years. On the flip side, some stocks which have low volatility, can remain non volatile for a good number of years as well.

Hence, you should not base your decision to go Long or Short by simply looking at Implied Volatility, although, all astute options traders will know IV of their underlying very well.

So, in summary, Implied Volatility rules...which is why no option trader will survive this game without having a very clear understanding of IV. I tell my friends that my mistress' name is Ivy. 8-)

About Theta

It's Time for Theta

Theta means Time Decay.

All options will expire one day, sooner or later. As time passes, each option will lose a little of its value due to the theta value that is attached to it. Particularly, all Long option positions value will suffer from such time decay, including weekends and public holidays, with no exception. Long options value decrease over time, because of Theta, even when the underlying stays absolutely still.

Let's review Google(GOOG), which is trading at $437.60. Its option chain is shown below.


Let me just digress a little and highlight a key ingredient; the Implied Volatility (IV) circled in green. The Sept08 options have all but 7 days to expire, the Oct options have 35 days and Dec, 98 days. Their respective Implied Volatilities :

Sept08 = 37%
Oct08 = 46%
Dec08 = 41%

Note that Oct08 has the highest IV. Please note that this is not to say that there is an error in the pricing model. The market is almost always perfectly efficient; especially when one is looking at such a liquid counter as GOOG. No one can tell the reasons for sure why the Oct's IV is higher than Dec's IV. What reasons accorded, can only be speculative, just as it speculative as to why a stock dropped 10% on a given day, without any apparent reasons. However, one can positively conclude that there exists a great deal of interests in GOOG's Oct options. The demand for these options, whether the buy or sell side, is the reason for this increased IV. It is simple economics 101. Mooncakes are most expensive becuase there is a higher demand for mooncakes during the Mooncake Festival and cheaper outside this period. Anticipated events can cause IV to increase.

However, there are always suggestions of market makers being responsible for artificially pumping up the next month's IV for all the reasons one can think of.

Now back to Theta.

Let's compare and contrast :

Within the same month, Theta exhibits this pattern

ATM options will have the highest theta assigned, as are the cases with Sept430 Call and Sept440. The reason is that, the best chances of success of any purchased options to get ITM (of cos other than those already ITM), will always be the ATM options. So, it is fair for options pricing model to allocate most premium to them, and that includes making the buyer of that ATM options, pay more for time decay. The seller of their ATM options, obviously, taking all the risks of writing, will demand a higher premium for ATM options.
Therefore, those ITM options, such as Sept400 Call, and OTM options like Sept470, will always contain comparatively lesser amounts of extrinsic value. Extrinsic value means, the additional premium an option pays for having the right to those options. With most extrinsic values attached to ATM options, correspondingly, Theta is highest always at those ATM options, both Puts and Calls.


Between Different Months, Theta Behaves in Discernable Pattern

Look at Theta for all Sept and Dec options. Across all strikes, Theta is smaller in Dec options than in Sept. For example, Sept 400 Call has a - 0.26 theta and Dec 400 Call has a - 0.18 theta. The reason that further out month has lesser theta attached to the options, is because there are many more days before those options expire.
Theta, or time decay, is experienced most when the options nears expiration. The effect is accelerated 30 days before expiration. So, in this Sept400Call, where theta is - 0.26, theoretically, ceteris paribus, theta will decay the option value by 26cents with every passing day and will decay the option value even more aggressively come closer and closer to the final expiration date.
At expiration date, all ITM, ATM and OTM options theta will revert to ZERO value. The value that time accords to these expired options, are no longer in existence. Hence, all options will lose their extrinsic value at the final second on expiration date.
In short, Theta is totally decayed at expiration date.

Now, if further out months options are supposed to have smaller theta, than why do Oct's options (being further out) have higher theta values across all similar strikes, when compared to Sept's? This is exactly opposite of what I described above.
There's no anomaly here. The only reason for Oct's options theta to be higher than Sept's is because of the markedly increased IV in the month of Oct. All that's been described about theta being highest at the ATM Oct option still applies.
But it should now be evidently clear to all that IV has a potent effect on other Greeks, including Theta. But had Oct's options IV be closer to ~39%, then those theta will likely be lower than their corresponding partners in Sept.

Increased IV will increase theta and a decreasing IV will decrease theta, everything else being constant.

This is the reason, that many traders will SELL options during HIGH Implied Volatility days and the reason why Asian traders shd NOT buy options (puts or calls) when HSI, SSE, STI do a stunning move...those warrants are very expensively priced. Since asian retail traders cannot SELL warrants, you are being forced to BUY them, if you wana trade warrants !!!! when the dust settles, and IV drops back to sane level, even if the index or stock price remain unchanged, your warrant values will drop very drastically....becos IV dropped.

Puts and Calls of Same Strike have Same Theta

There's is usually very difference in Theta figure for Calls and Puts of the similar strikes.

Theta can kill Long option traders, silently...

What About Gamma ?

Gamma

Gamma's sole purpose is to affect the Delta. It can either be friend or a foe to Delta.

As we have discussed, Delta, is the greek that determines the amount of change to the option price, when the underlying moves by a point.

Then, you will understand when Gamma is defined as the Delta's delta; ie, Gamma determines the amount of change to Delta when the underlying moves by 1 point. If delta is a the 1st derivative then the gamma is the 2nd derivative. If delta is velocity, then gamma is acceleration.

Let's look at Visa (V), currently trading at $71. The current option chains are shown below.


A Long 70Call has a delta of 0.56 and a gamma of 0.08. If V rallies up $1, then 70Call delta will change to 0.64 (0.56 + 0.08). If V drops by $1, the same option's delta will also drop to 0.48 (0.56 - 0.08).
So, it is clear that Gamma has a direct impact in the value of the option's delta. The more +ve Gamma that option position has, the bigger the movement of value option's price will swing.
This is the reason that when Long OTM Call positions are very unreactive to underlying price movement. The V example shows this.
Look at 80Call option, this is OTM Call. It has a delta of 0.04 and a corresponding gamma of 0.02. Even if V rallies from $71 to $72 now, the 80Call delta will only be increased to 0.06 (0.04 + 0.02), which translates to a 6 cents movement in 80Call value. Obviously, this OTM Sept80Call isn't worth much now; about 7.5cents and has only a 4% chance that it will become ITM by 8 days time, when this option expires.
Do you remember how we conclude that this OTM80Call has only 4% chance of getting ITM? If not, you should re-read the post on Delta.

Now for the confusing part.

Supposing you had Long V 65Call which has now a 0.82 delta and 0.04 gamma. But imagine, for some reasons, your gamma was -ve 0.10. This can happen when you have multiple option positions of the underlying, that results in a +ve delta and a -ve gamma.
If the position has a NET +ve 100 delta, supposedly, you would want the stock to rally, since a NET +ve delta is a bullish position and will be profitable only when a rally occurs. BUT, the overall gamma of this combined positions, as stated was -ve 20. Then in a 1 point rally, your delta will be reduced to +ve80 (100 - 20). This is no good. Of cos, as the stock rallies up $1, you will still make that $100 (from the initial 100 deltas), but supposing it now rallies another point, from $72 to $73, effectively, you additional profit is only $80. You will still be making money, just not as much. What is responsible for this mess up? Gamma, of cos.

Similarly, in any bearish position, where the delta is -ve, you will want to gain delta as time passes. In this case, gaining delta for a bearish position, means making the delta more "-ve"; as in -0.9 is better than -0.2. This is the tricky part; so pay attention. You will still want a +ve gamma for a -ve delta position. It is not intuitive, but it is correct notion. A +ve gamma will make a -ve delta more -ve , when the price of the underlying drops.

Another way of looking at Gamma, is to think in terms of Volatility. If you were Long or Short a position, you certainly want price action, don't you? Afterall, a stationary market will slaughter all single directional bets, like Long Call and Long Put. Hence, when you have such positions, you want Gamma to be as gigantically +ve as possible.

But, if your option strategy is for the quiet market, then you want -ve Gammas to "tame" those deltas, and even making them as small as possible..

Hence, option writers (stationary or non-volatile option positions; such as Short Strangle or Short Straddle), will want -ve gammas in their option portfolio....

If you look carefully at the option chain above, you will see that gamma is largest for ATM options. This is always the case. The reason is very simple. At expiration, all ITM Call options will have delta +1 and all OTM Call options will have 0 delta. Similarly, ITM Puts will have -1 delta and OTM Puts will have 0 delta.
Now, we are 5 minutes away from closing bell of expiration day. V is trading at 74.90, the 75Call has a good chance of being ITM and is now 0.25 delta. One second passes and V trades 75.05, this 75Call's delta immediate jumps to 0.89. See the movement of delta from 0.25 to 0.89. That huge change is caused by Gamma. Hence, all ATM options has the largest Gamma.

so, in summary, this is how these 2 GREEKs interact with Calls and Puts

.................................................Delta....................Gamma

Long Call..................................+ve...........................+ve
Short Call.................................-ve............................-ve
Long Put..................................-ve............................+ve
Short Put.................................+ve...........................-ve

Thursday, September 11, 2008

Volatility

Volatility

A word on Volatility.

A stock is said to be more volatile than others or when compared to its past , it means that its stock price has a tendency to fluctuate over a large range.

Hence, a sector ETF maybe less volatile when compared to a single stock of that same sector. This is because this ETF encompasses a wide variety of stocks. If only a small number of stocks within this ETF make huge price movement, and a great deal of others stay relatively unchanged, then the price of this ETF will not gyrate as much. It's all about statistics.

Volatility is, in fact, everything about mathematical statistics.

To understand Volatility a step further, we must introduce another statistical term, called Standard Deviation. They are a pair of Siamese twins. Speaking of one without referencing to another, is of little meaning.

Let's not talk soldiers on paper, so to speak. Let's use a real life example. Lehman Brothers (LEH)

LEH is current trading at ~$5. It was traded for ~$20 some 6 weeks ago and $65 just 9 months ago. One can consider LEH as a highly volatile stock. LEH price dropped a hefty 92% over a period of just 9 months. But exactly how volatile is this LEH and how do we quantify its volatility.

To exact how volatile a stock is, we must always look into its past price action; ie its historical price movement. Therefore, when we refer to a stock's past volatility over a period, we actually mean its Historical Volatility (HV). There's little for argument on this HV figure. Afterall, its the past and how can we argue that the price actions didn't occur.

The only debatable issue is the period in which this HV is calculated. Should the period used for calculation be 1 month, 6 months, 1 year, 5 years, or more? There's no straight answer. For a pattern trader, the shorter term HV makes more sense than to a long term investor, who might be more interested in a 3 year HV. Different periods used will show different HV, the very same reason why MA50 and MA200 are different. Therefore, one must know the period used when deriving HV.

At $5, LEH now exhibits a volatility of ~300%. This 300% is an annualized figure. What this means is that, ceteris paribus, in a year's time, LEH will have a 68% chance of trading between +300% or -300%. Now, of cos, $0, is the most that LEH can go to. But +300% means that LEH could be at $20 by then, and there's a 2/3 chance of it happening. To paraphrase, and using the Gaussian distribution (aka as Normal distribution), LEH stock price has a 68% chance of making ONE standard deviation movement in price, a 95% chance of a price movement within TWO standard deviations and a 99% chance of a THREE standard deviations movement, all in a year's time.

What if a trader wants to know the volatility other than the annualized 300% volatility? The calculation is as such:

3 month vol = 300% x 1/2 = 150% (square root of 3months /12 months = 1/2)
1 month vol = 300% x 1/3.46 = 87% (square root of 1month / 12months = 1/3.46)
1 week vol = 300% x 1/7.2 = 42% ( "" )
1 day vol = 300% x 1/16 = 18.75% ( "" )


so, with 1 day volatility at 18.75%, LEH could range between $5.93 to $4.06, all this in ONE day...

a quick check on LEH's performance today....5..30 to 3.88....now, that's pretty accurate, so far.

Delta Hedging

Delta - Revisit Again

Delta Hedging


In the above example of positions in IWM, there is a net +ve 9.65 deltas (let's just round this off to +ve 9).

This simply means that, at that juncture, if IWM rallies 1 point (meaning $1), this position will gain 9 cents or if IWM drops by $1, then this overall position will lose 9 cents.

Suffice to say that, a trader must watch the overall delta figure. If the delta of this IWM shoots up to 1000, then for every $1 movement of IWM, the portfolio will either win or lose $1000.

Now for the concept of delta hedging.

A trader may decide to hedge this above investment portfolio when the overall delta position becomes too large. Supposing, that the IWM options portfolio above went from +ve 9 delta to +ve 200 delta, which means this trader will win or lose $200 with every 1 point movement in IWM shares at that new delta figure.

Decidedly, this is too much of a risk for this trader to stomache. He can take either of these actions :

a) cut down the position size of his options, either by closing off bullish positions or adding on bearish positions, which will generate -ve deltas. as a result, this +ve 200 delta will be reduced.

b) Short IWM stocks. for every 100 shares of IWM that he shorts, he will accumulate -ve 100 delta. ONE Long share of IWM has corresponding ONE +ve delta, so ONE Short share is ONE -ve delta.

If he wants to reduce his delta overexposure by 100, then he could Short sell 100 shares of IWM. He will then bring his overall delta down to +200 from +100. This technique is known as Delta Hedging.

But delta changes all the time; it never stays static, not unless the underlying freeze in price movement.

Therefore, delta hedging is cumbersome, involves high overhead costs and is usually only practiced by professional traders/fund houses/floor traders, where the commission fees are markedly lower to non-existent.

So, the purpose of this writeup, is only to highlight that deltas change and for many reasons. In this case, deltas can change because the underlying IWM price changes. However, it is important to note that deltas can and will change, even when IWM price remains relatively unchanged. Deltas change with the passage of time and Implied Volatility.

Wednesday, September 10, 2008

How To Handle Butterflies At Expiration

Bull Spread - Long OTM Call Fly (addendum)

A few key characteristics of this spread to take note of.

a) The maximum profit will occur when the underlying trades exactly at the Short strikes; ie SPY = 126. The chance, as mentioned, is low.

b) This spread consists of 4 options, since it involves 2 call spreads. Correspondingly, the commission fees is comparatively higher than most other option spreads.

c) Depending on where the underlying is trading at expiration date, one may not have to close off all the Call positions inherent in this fly.
Supposing, come very close to expiration date, perhaps even on the day this spread is to expire, SPY is trading at $120, making all the Calls Out of The Money, then simply just accept the 0.34 as your maximum losses and let this spread expire worthless. It is pointless to close off this spread, pay another 4 way commissions when there's no benefit for doing so.
Supposing, on expiration day, SPY is trading at $134, even though making all of your Call positions of this fly spread ITM, it is still pointless to expense another 4 way commissions to close off this position, when you would also be experiencing the maximum losses of 0.34. By closing off this position, won't make you a penny richer. Hence, why increase the losses further with commissions payable to exit.

The interesting part, is when SPY, on expiration date, trades between your profitable range of 124.34 and 127.66.

This is a little complex. So bear with me.

If SPY is within 124 and 126 range, you MUST at least sell off the Long124Call position, otherwise, you will be assigned, resulting in you being the proud owner of SPY ETF shares. You could sell of the entire fly spread as well. Which of the two actions to take, is more of an art than an exact science.

Let me explain...supposing you have 1 hour left on expiration date, and SPY is hovering around 125 region and SPY has been struggling to head higher. You think that SPY will not go beyond 126, nor will it drop below 124 within the next hour. Then you could just sell the Long 124Call and let the remaining Calls expire worthless. This will cut down on your trade commissions.

However, if you think there is a good chance that SPY will trade above 126 at the closing bell, then it is best that you close off the entire fly spread. The reason is this; if you had just closed off the Long 124Call position, leaving behind 2 short 126Calls, you are exposing your short calls getting ITM at closing bell. If SPY indeed closes at >126, you will be obligated to deliver SPY ETF shares and if you dont own them, then you will have Short stock positions come monday after expiration. These are not cheap stocks, to short stock, you need to have a huge amount of money in your account to margin this short stock position. If you dont have enough funds in your account, problems will balloon.
(to minimise the complexity of this explanation, the suggestion is to close off the entire fly spread, when in actual fact, you could just close off only the 124Call and 126Calls. Leave the 128Call alone, unless SPY went mad and shoots above 128 at the last minute before closing bell)

Thus, butterflies can be beautiful to look at, but potentially problematic to handle. The advice is, be very familiar with the concepts of this spread before trading the Fly.

Bull Spread - Long OTM Call Butterfly

Bull Spread

Long OTM Call Butterfly

Yes, i know how intimidating this high sounding name can be. So, let me attempt to explain what this Bullish Spread is about, in a way that even I can understand.

The simplest definition of a Long Call Butterfly is this : Long Call Spread + Short further OTM Call Spread

For our example to illustrate the Long OTM Call "fly", we will use SPY (SP500 Index ETF). SPY is currently trading at 123.60

Long +1/-1 SPY Sept124/126Call and Short -1/+1 Sept126/128Call

Breaking this down granularly, it is:

Long SPY Sept124Call and Short SPY Sept126Call (which is a Long Call Spread)
Short SPY Sept126Call and Long SPY Sept128Call (which is a Short Call Spread)

As you have read, this Long Call Spread is a bullish position, which has limited profits and limited losses. Hence, limited risks in exchange for limited rewards. Similarly, this accompanying Short Call Spread, will also have limited upside and downside. Hence, in a gist, a Long OTM Call fly is a limited risks and limited reward position.

Under normal circumstances, a fly is an affordable option strategy with the aim of reaping multi-fold returns. This can occur but the probability of this event occurring, is correspondingly low. Low probability of success, translates to lower cost of this trade; fair.

When to use : Mild Bullish Outlook
How to establish : LONG OTM Call Spread and Short further OTM Call Spread
Debit or Credit : Usually a small debit
Margin Requirement : Yes
What is the Maximum Profit : Limited
What is the Maximum Loss : Limited


Profit/Loss Explanation
Debit of Long 124/126Call Spread: -0.84
Credit of Short 126/128Call Spread : +0.50
Total NET Debit = -0.34

Max Profit : 1.66 (strike 126 - strike 124 - 0.34 debit paid)
Max Losses : 0.34
Breakeven Points : 124.34 (124 +0.34) and 127.66 (128 - 0.34)
Profitable Range : SPY between 124.34 and 127.66


Take this opportunity to solidify this calculation concept. Once understood, it will help with understanding future examples.
Basically, the Long Call Spread of this fly has a maximum profit of 2 (126 - 124). But you have already paid 0.34 for this position, and so, in reality, the Max Profit can only be 1.66 (2 - 0.34). Only if SPY trades above 124.34 at expiration, will this position be profitable. Hence the breakeven point is 124 +0.34.

Similarly, the max that you can lose on the Short Call Spread is also 2 (128 - 126). But in order that you do not lose more than 2, you must account for the initial 0.34 debit paid. Hence, the second breakeven point is 127.66 (128 - 0.34).[/i]

Risk/Reward Returns : 0.34 /1.66 = 20.5% in 9 calendar days or 830% annualized returns.


With such a high risk/reward returns, one can expect that the probability of success for this trade, is low. This is the trade off. Think of it as paying 50cents for a TOTO ticket. It pays very handsomely if your TOTO numbers are picked; but that's a slim chance. Consequently, you only need to pay a small price for this chance, a mere 50 cents.

Therefore, just remember that a Long Butterfly is like buying TOTO... small saw to chop a big tree.

P/L Chart - Long +1/-2/+1 SPY Sept 124/126/128 Call Butterfly


Tuesday, September 9, 2008

Bull Spread - Long Call Ratio Spread

Bull Spread

Long Call Ratio Spread

While this is a Bull Spread option strategy, it can be a market neutral to bullish bias and non directional option strategy.

When to use : Neutral to Bullish Trend
How to establish : LONG 1x Call and Short 2x Call
Debit or Credit : Credit (preferably)
Margin Requirement : Yes
What is the Maximum Profit : Limited to between the Long and Short strikes
What is the Maximum Loss : Unlimited

Example :

Starbucks (SBUX) is trading at $15. You believe that their recent cost cutting measures will optimise their operations by lowering costs and perhaps even increasing their margins. However, you think that SBUX could stay range bound with a possible rally when it reports earnings in Sept. But the upside to SBUX price should have a ceiling in the near term with such uncertainty in consumer spendings.

Again, because we are now in Sept and the Oct Call options will be expiring in a month's time, you do not wish to be disadvantaged by Theta (the greek for time decay). Theta is most aggressive for options with ~30 days remaining to expiration. You want a strategy that will mitigate losses resulting from theta and also since you opine a upward limit to where SBUX price will go to, you then establish this option strategy :

Long 1x SBUX Sept15 Call and Short 2x Sept 16 Call - this is known as a Long Call Ratio Spread

This position is similar to a Long Call Spread, with an added Short OTM Call; meaning, in our example,

Long SBUX Oct15Call and Short Oct16Call (which is a Long Call Spread) and added Short Sept16Call

The Short Calls position is established mainly for 2 reasons :
a) To compensate you for the loss due to time decay, as Short options earns you time value whereas Long options penalizes you Theta.
b) You believe that SBUX will NOT head much higher


Note here, that the contract size of the Short position is 2 times of the Long position. This is known as a 1 x 2 ratio spread. You could, if you choose to, establish a 1 x 3, 1 x 4, 2 x 5, or any other contract size combinations but the size of the Long position is always smaller than the Short position. More importantly, the bigger the multiplier of the Short option, the bigger the assumed risks. Hence, a 1x4 Ratio Spread has a bigger risk component than a 1 x2 or 1 x3 Ratio Spread.

Special Note : Ratio Spreads can start by having a -ve Delta, or a small +ve Delta, even though this is considered a Bullish Spread. Recall that you always want large +ve Deltas for bullish position

A simple way to look at a Long Call Ratio Spread, is this. It is a Long Call position, where the premium paid to establish this bullish position, is entirely funded by the multiple Short OTM Call positions. This ratio spread, should be established for a NET credit, or it will not be justifiable for assuming the associated risks of unlimited losses.

In our example, Oct15 Call is priced at 1.15 and the Oct16Call is trading at 0.63. By buying ONE Oct15Call and selling TWO Oct16 Calls, you will receive a NET credit of 0.11 ( 2 x 0.63 - 1.15). This means, you are actually paid to trade this position.

In this SBUX example, these are the following 2 Greeks:
Delta = -ve 0.24
Theta = 1.07

A -ve delta for a bullish position is no good. The reason is that even for a 1 point increase in SBUX price, this ratio spread is effectively losing money because the -ve delta will reduce the spread's value. The good news is, this -ve delta will have a chance of turning into a +ve delta. This effect can be caused by the passage of time and SBUX price. The inter-relationship between Greeks is a rather complex topic, which I will hope to cover in a separate post.

A +ve theta is always a good cheer. As time passes, even if SBUX price remains stationary, you add 1.07 to your ratio spread value everyday. This +ve theta value increases over time.


Profit/Loss Explanation :

(you will have to assume these option prices are correct)

Debit for (ONE contract) Long Oct 15 Call = -1.15
Credit for (TWO contracts) Short Oct 16 Call = 1.26 (2 x 0.63)
Total Credit = 0.11

Maximum loss : unlimited
Maximum profit : 1.11 ( 16strike - 15strike + 0.11 credit)
Breakeven point : 17.11
Profitable range : SBUX trades below $17.11 at expiration
Risk/Reward Ratio = if SBUX rallies to the stars, then this ratio is unquantifiably high.


The breakeven point is 17.11. The maximum profitable spread is $1 (16strike - 15strike) because you have a right to buy SBUX at $15 and you are obligated to sell it at $16, should SBUX trade above $16 anytime before and up to Oct expiration date. If this happens, you now have $1 profit as your cushion if this spread moves against you subsequently. The value of this spread peaks when SBUX is trading at $16 at expiration.
In this case, should SBUX continue to rally from $16 to $17, you are now losing $1 because of the additional Short Oct16 Call. You then use the $1 you made to pay for this $1 of losses. You can afford to let SBUX rally until $17 without incurring a loss yet. Remember, when you put in this trade, you received $0.11 credit. Therefore, your actual breakeven point is when SBUX is trading at $17.11 at expiration (not before and not after but exactly at expiration).

If SBUX trades below $15 at Oct expiration date, all the 3 Call options of this ratio spread will expire worthless and you keep all the credit received; ie 0.11 The reason that this spread will expire worthless is this. No one will exercise the Short Oct16Calls, because no one will want to buy SBUX for $16 when it is now trading below $15. Likewise, you will not exercise your Long Oct15 Call and buy SBUX at $15.

Hence, a Call Ratio Spread, allows a trader to profit, in these scenarios :

a) when the underlying rallies up to just before breakeven point
b) when the underlying stays unchanged by expiration
c) when the underlying drops in price, modestly or even to $0 value

This Call Ratio Spread is profitable in just about all possible price movements, except for a sudden and major gap up beyond the breakeven point. Then, in this case, the losses can be theoretically unlimited.

Hence, for most seasoned traders, Ratio Spreads is always among the arsenal of option strategies they employ.


+1/-2 SBUX 15/16 Call Ratio Spread P/L Chart

Bull Spread - Cylinder

Long Call and Short OTM Put - aka Cylinder

A Bull Spread, as the name implies, is bullish bias and a directional option strategy.

When to use : Bullish Trend
How to establish : LONG a Call and SHORT OTM Put
Debit or Credit : Debit
Margin Requirement : Yes
What is the Maximum Profit : Unlimited
What is the Maximum Loss : Unlimited (theoretically)

Example :

SMN Ultrashort Basic Materials Proshares is currently trading at $46 You believe that there is a bullish trend to this ETF. You wish to ride the trend to the maximum.

You could just simply buy a Call option on SMN, which will give you unlimited profit potential if SMN price rallies extraordinarily. However, you are concerned about time decay on this Long Call position. The current implied volatility is at about mid point of it's historical low and high. Hence, this Long Call may not be overpriced.

However, you are so bullish on this ETF, you truly have reasons to believe that this ETF will very likely continue on its upward movement. Hence, you do not expect this ETF to drop substantially in the short term.

So, you decide that Long SMN Octt45 Call and Short Octt40 Put, this is known as a Long Call, Short Put combo (aka as a Cylinder)

This position is similar to a Long Oct 45Call, in terms of unlimited profits potential. For this privilege, you pay a premium of 4.30. This is costly considering that 3.30 * out of this 4.30 is extrinsic (or time value), which will decay in some 38 days. To mitigate this time decay, you decide to Short a Oct 40Put and receive 1.10 credit. But nevertheless, this trade is a Net Debit position, meaning you pay a fee for this Cylinder. In this case, you will pay 3.20 (4.30 - 1.10)

*Side Note : Extrinsic Value of Call option= Option Price (4.30) - {SMN price (46) - Strike Price (45)} = 3.30

Position yields a breakeven when SMN trades above 48.20 (45 + 3.20) at expiration. As mentioned, since this is a really just a Long Call (but funded by a Short OTM Put), the profit potential is unlimited.

However, nothing in trading is a free lunch. Due to the 1.10 premium collected from the Short Oct40Put, the potential loss of this position is unlimited, well at least theoretically. If SMN for any reasons, drop to $1 at expiration, the losses will be $39/share + the Net Debit amount paid.

Remember, a Short Oct40Put obligates you to BUY SMN ETF shares at $40/share, if this stock drops below $40. This is american style option, and so, assignment can happen and WILL happen as soon as SMN trades below $40. Don't ever doubt that someone will insist on selling you SMN at $40/share. A Short ITM Put, will always be assigned.

Therefore, you MUST be prepared to add SMN into your stock portfolio, when you choose this Cylinder strategy. Afterall, this should not be a conflict with your bullish view of this ETF.

Finally, note that Oct40Put has a Delta of ~0.21. Recall that Delta is a rough gauge of the probability of that option getting ITM by expiration. Thus, you must understand that the probability of this Short Oct40 Put has a 21% chance of being ITM by Oct expiration. This also means that you have roughly a 79% chance in your favour.

Profit/Loss Explanation :

(you will have to assume these option prices are correct)
Debit (means you pay) for Long Oct 45 Call = -4.30
Credit (means you receive) for Short Oct 40 Put = 1.10
Total Debit = - 3.20

Maximum loss scenarios :
if SMN trades between 40 - 45 at expiration = 3.20
if SMN trades below 40 at expiration = loss is potentially unlimited

Maximum profit = SMN trades above48.20 (above 45 Call + 3.20 debit paid)

Risk/Reward Ratio = this is a high risk and correspondingly high returns trade


Long Oct45Call and Short Oct40Put P/L Chart

Monday, September 8, 2008

Option Delta - Revisit

Option Delta - The Probability of an Option Expiring ITM

The simplest way to use Delta, is to view it as :

The probability of that option expiring In-The-Money

Example of SPX OTM, ATM and OTM Puts and Calls


SPX is traded at 1242 as of 5th Sept 08.

Note that Sept 1240 Put and Call, which represents Near-The-Money, but for ease of explanation, let's just say they are both ATM Put and ATM Call.

These ATM options have close to 0.50 delta (ignore the +ve and -ve signs). This means that these ATM options have ~50% chance of being ITM by the expiration date. It makes sense, since SPX last traded at 1242, can only move up or down and all things being equal, SPX has a 50-50 chance of going either way. The ATM options reflect this probability.

Now look at the deep ITM 1180 Call, it's delta is 0.92 or a simply a 92% chance, given all things being equal, that by expiration, this 1180 Call will remain In-The-Money. Remember that this Sept Options have only 10 more days to expiration. This is a meaningful interpretation because, ITM 1180 Call strike being 62 points deep ITM currently, does obviously have a much better chance of remaining ITM by expiration as compared to OTM 1300 Call strike, which has a mere 12% (delta of 0.12) of being ITM in 10 days' time.

For this OTM 1300 Call strike to be ITM, SPX must rally past 1300 in the next 10 days. Whereas, SPX just needs to stay rather unchanged or can even dive in the next 10 days, and yet the 1180 Call strike will still be ITM, as long as SPX stays above 1180. Between the 2 options, the ITM 1180 Call, has 2 out of 3 scenarios covered and hence a higher probability of staying ITM by expiration and thus a much higher Delta of 0.92

Hence, as a back-of-the-envelope review, an option's probability of becoming ITM by expiration, can be obtained by simply looking at the option Delta.

Option Delta - Absolute Put and Call Deltas Add Up to ~1

The 1240Call has 0.53 and the 1240Put has 0.47. Note, that +ve or -ve Delta is NOT a function of whether it is a Put or Call.

The example shows -0.47 for 1240Put, only because it is saying that a LONG Put, a bearish position, will generate a -ve 0.47 Delta.

Note that the absolute values of ATM 1240 Call and ATM 1240 Put, add up to 1; ie

|0.53| + |-0.47| = 1

In fact, if SPX was traded at 1240 exactly, these ATM 1240Call and ATM 1240Put would each have a delta of 0.5, and will practically add up to a full integer 1.

This is also the reason that a Straddle, which is a Long ATM Call and Long ATM Put position, will not be profitable, when only a small movement occurs. A perfect straddle, has exactly ZERO delta; the Long ATM Call option has +ve0.5 and the Long ATM Put option has -ve 0.5, and the combined position, results in an absolute 0 delta value. Thus, for Straddles to be profitable, a huge move must occur in either direction.

However, notice that both the deep OTM Call (1180) and deep ITM Put (1300) options, and conversely ITM Call and OTM Put options, their corresponding Deltas do not absolutely add up to 1.
The reason is that these OTM/ITM option Deltas are artificially affected by Implied Volatility, Gamma and +ve/-ve PutCall Volatility skew. This is a topic for another day.

But suffice to say that the Straddle's delta changes because the Gamma of the Call and Put options change when the underlying starts making large price movements. This Gamma then causes the Straddle to either net gain or lose Delta, which translates to profits.

Wednesday, September 3, 2008

Bull Spread - Short Put Spread

Bull Spread

Short Put Spread

When to use : Neutral to Bullish Trend (this captures 2 out of 3 possible scenarios)
How to establish : Short a Put and Long a lower strike Put
Debit or Credit : Credit
Margin Requirement : Yes
What is the Maximum Profit : Amount of credit received (limited)
What is the Maximum Loss : Amount between the 2 strike prices less credit received (limited)

Example :

GOOG is currently at $466.10 in early Sept
You expect GOOG to rally and have reasons to believe that it is well supported at $450, in the near term.
You choose options as it is too capital intensive to pay $46,610 for 100 shares of GOOG.

You could just simply sell a Sept 450Put option on GOOG and receive a premium(credit) for this sale. If GOOG's share price stays rather stable until option expiration, you benefit from time decay; ie you gain theta as time passes. If it rallies, then you profit from the decline in the Put's value.

But, you are worried that GOOG's shares price may suddenly drop drastically below $450, you will suffer (theoretically)unlimited losses. In fact, should GOOG's shares price ever drop catastrophically to $0, your losses will be equivalent to losing $450 per share. So, if you had sold just ONE contract of 450Put, your losses will be $45,000. This is no joking matter. But it would be a joke if GOOG shares become worthless.
Remember that one should not consider Short Put positions, if one is not prepared to purchase the stock at that Short strike price

Therefore, all naked short positions, whether Put or Call, and especially Short Call, can be HIGH risk trades. Traders must very closely monitor all naked (aka uncovered) Calls and Puts.

Hence, to mitigate the risk of a naked Put, you purchase a Sept 440 Put (just in case shit does hit the fan). The risk is mitigated because you will be insulated from further downside beyond $440. Your Long 440Put effectively serves as a "protective Put". This combination of Long and Short Puts, is known as a Short Put Spread.

This Short 450 Put position, obligates you buy GOOG at $450 and the Long 440 Put conveys you the right to sell it at $440. In return for this seemingly unfavourable trade, you receive a premium (equal to the amount of credit paid to you). In this example, the credit is 2.70. This credit compensates you for the risk involved in potentially buying high and selling low. Hence, a reward this risk assumed when you establish this Short Put Spread.

Position yields maximum profits when GOOG shares are at or above 450 at expiration, because this will render the all the Puts worthless. The maximum profit potential is the credit received; ie 2.70. The breakeven point for this trade, at expiration, is 447.30 (450 - 2.70). Hence, at expiration, if GOOG settles anything below 447.30, a loss will incur. The maximum losses is limited to 7.30 (450-440-2.70) because when GOOG trades below $450, you would be obligated to buy GOOG at $450 and have the right sell it at $440, a potential loss of $10. But, since you have already been credited $2.70 for this Short Put Spread, the maximum damage is reduced by this amount.

((an important note about Short Put Spreads : Consider that GOOG shares subsequently trades below $450 but higher than $440 any time before and up to expiration date. You will very likely be assigned 100 shares for every ONE contract of 450Put option sold. This means, you will need to have $45,000 in your account or if your broker grants you some leverage, a smaller amount is still nevertheless required to buy this 100 shares of GOOG at $450/share.
If this happens, you will end up with LONG 100 GOOG shares and a Long 440Put option position. If GOOG rebounds without going below $440, then your Long 440Put will expire worthless. This makes sense because you will most certainly not want to exercise your right to sell GOOG at $440 when you can sell them in the open market for a higher value.

In other words, for all Short Put Spreads, there is always the chance that you will be assigned with shares you are obligated to buy at a higher strike price, yet you may not necessarily want to exercise your right to sell those shares at a lower strike price. Please understand this assignment risk very well))

Profit/Loss Explanation :

((you will just have to assume that these option premiums are accurate))
Credit (means you receive) for Short Sept 450 Put = 8.60
Debit (means you pay) for Long Sept 440 Put = -5.90

Total Credit = 2.70

Maximum loss = 7.30 (440 - 450 + 2.70)
Maximum Profit = 2.70
Breakeven point = 447.30 (450 - 2.70)
Profit Range = anything at and above 447.30

Risk/Reward Ratio = 6.30 / 2.70 = 2.7; ie you risk 2.7 for a profit potential of 1.00 (but remember, you win in 2 of 3 scenarios. in fact, you can still profit if shares drop slowly but stays above 447.30. hence making the probability of a successful trade in 3 out of 4 cases)

The profit and loss is illustrated using the chart below

Bull Spread - Long Call Spread

Bull Spread

Long Call Spread

When to use : Bullish Trend
How to establish : LONG a Call and SHORT a higher strike Call
Debit or Credit : Debit
Margin Requirement : No
What is the Maximum Profit : The distance between the LONG and SHORT Strikes (limitted)
What is the Maximum Loss : Amount paid (the debit) for the spread (limited)

Example :

RIMM is currently at $121.10 in early Sept
You expect RIMM to rally and have reasons to believe that it will have the potential to increase its share price to a maximum of $130, in the near term.
You then contemplate a bullish option position, since it is too capital intensive to pay $12,110 for 100 shares of RIMM.

You could just simply buy a Call option on RIMM, which will give you unlimited profit potential if RIMM price rallies extraordinarily. However, you are concerned about time decay on this position that is soon expiring. The current implied volatility is also high given a volatile market in the recent days. These 2 GREEKS will work against a simple Long Call position. Besides, it is also expensive to just buy a Call option.
Fyi, 1 contract of option is equal to right to trade 100 shares of the stock.

So, you decide to purchase a Sept 125 Call and sell a Sept 130 Call option spread. This is effectively, a Long Call Spread.

This Long Call Spread, gives you the right to buy RIMM at $125 and the potential to sell RIMM shares at $130, for which you pay a premium (equals to the amount of debit paid for this spread)

This position is similar to a Long Sep125 Call, but limits its upside profit potential when RIMM reaches $130. Consequently, for this reduced profit potential, you pay a smaller debit for this spread, and hence reduce your risk for this trade. Makes sense, since lower reward must be matched by a lower risk.
In this example, the premium(debit) of this spread is 1.50 (i shall only use unit rather than actual $ amount in all my examples)

Position yields maximum profits when RIMM shares are at or above 130 at expiration. The maximum profit potential is 130 - 125 net off debit paid. The breakeven point for this trade, at expiration, is 126.50 (125 + 1.50). Hence, at expiration, if RIMM settles anything below 126.50, a loss is experienced. The maximum losses will be limited to the premium of 1.50 paid and happens RIMM shares falls below 125 at expiration.

Profit/Loss Explanation :

(you will have to assume that these premiums are accurate)
Debit (means you pay) for Long Sept 120 Call = -3.30
Credit (means you receive) for Short Sept 130 Call = 1.80
Total Debit = 1.50

Maximum loss = 1.50
Maximum Profit = 3.50 ( 130 - 125 - 1.50)
Breakeven point = 126.50
Profit Range = anything at and above 126.50

Risk/Reward Ratio = 1.50 / 3.50 = 0.43; ie you risk 0.43 for a profit potential of 1.00

The profit and loss is illustrated using the chart below

What is an Option Delta ?

Before proceeding to advocate the other strategies, let's pause to review the significance of a Greek, namely Delta...

What really is Delta?
This is what determines the amount of change to the option price with 1 point movement of the underlying.

When is Delta Positive and Negative?
Every option, both Calls and Puts, is assigned a delta figure. It ranges from -1 to +1.

For bullish positions, delta will range from 0 for deep Out of The Money (OTM) options to +1 for deep In The Money (ITM) options, while those At The Money options (ATM) will have a 0.5 delta.

Conversely, bearish positions, will yield -1 for deep ITM options, while ATM options will give assigned a -0.5 delta and those OTM options will have 0 delta.gains $0.04; pretty insignificant. But, it makes sense because it is so far OTM.

To illustrate this concept, let's assume IWM is now trading at $74.

A Bullish position, such as a LONG deep ITM Sep61Call, will have +1 (or very very near this integer)
Another bullish position, such as a SHORT deep ITM Sep90Put, shows a +0.925 (pretty close to +1 as well)

From the above, you will appreciate that whether the delta is positive or negative, has nothing to do with whether the option is SHORT or LONG. This is a common misunderstood fact, that can cost many bullish traders to lose money even when market rallies. It may sound impossible, but it can happen.

Hence, in a gist, whether the delta of your position is positive or negative, is dependent on whether it is Bullish (positive delta) or Bearish (negative) position.

How Does Delta Affect Option Price?

Long IWM Sep61Call (bullish position), now has +1 delta and is priced at $13.15. When IWM moves up by $1, this Call option will correspondingly move up to $14.15, exactly increasing by $1 as well. If IWM drops by $1, so will this option fall by exactly $1. The reason, it has a Delta of +1. It is hence, a 1 to 1 option to stock price movement relationship. Therefore, this call option behaves like IWM shares.

Long IWM Sep74Call, which is about ATM strike, now has a delta of 0.53 and is priced at $1.67. When IWM moves up by $1, this long call option will only increase by $0.53 and correspondingly, falls by also $0.53 if IWM drops by $1.

Short IWM Sep66Put (a OTM bullish position), trades for $0.08 and has a delta of 0.04. Note that, even while this is a SHORT position, it still has positive delta. This means, IWM increases by $1, this position will increase by only $0.04. But it makes sense, because this option is so far OTM.

The table below summarizes the polarity of Delta for Bullish and Bearish positions.

Overview of Option Strategies

Option Spreads 

often, we can make sound assessment on where an underlying maybe heading towards but quite lacking the correct skillsets to capitalize on that judgement.

 for most investors/traders, buying or shorting stocks, indexes, ETFs, even commodities are just about the only ways to engage the market. 

fortunately, Options as the derivative, can be deployed in more ways than one, either to manage portoflio risks, obtaining acceptable risk/reward returns, or simply to profit, and thus may be used as an alternative investment vehicle to trading the actual underlying. 

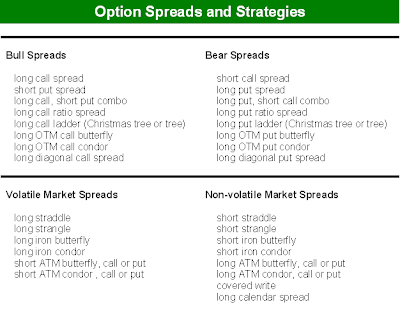
over time, i hope to dwell into each of these Option Spreads and strategies, postulate when each can be deployed under different market conditions, their associated risks, rewards and profit potential. meanwhile, below lists the various Option Spreads and suggests which ones can be deployed under 4 different market conditions.